

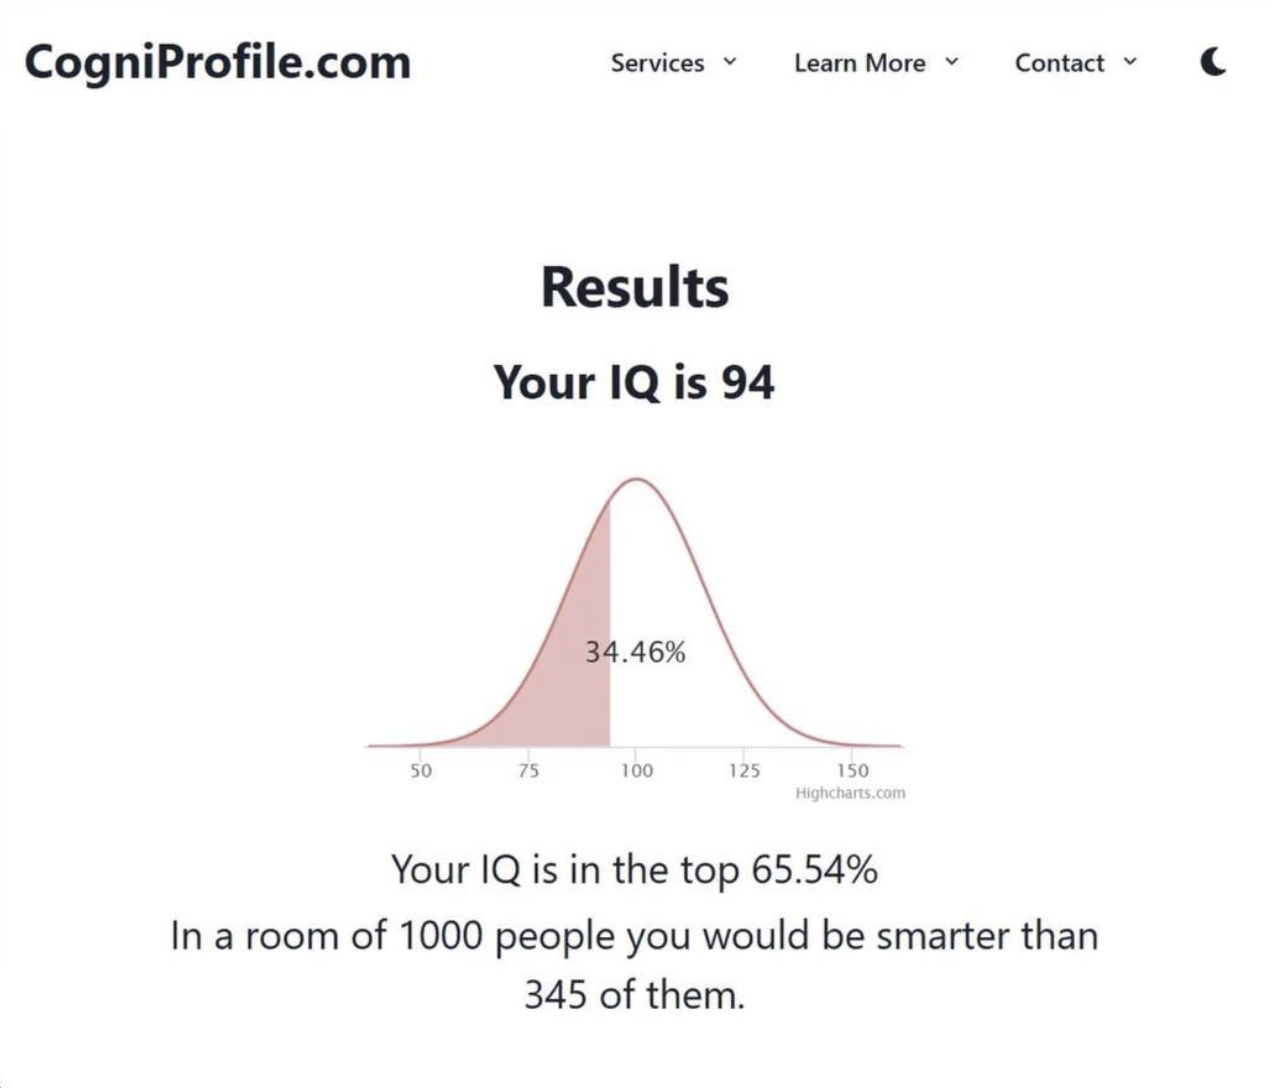
If you read the sentence “out of 1000 people you are smarter than 345 of them” and you think that is something to brag to your friends about, then that is on you.
Aside from the fact that these “tests” are likely not accurate or legit.
I really hope this is a shitpost
That’s a normal distribution. The average is right in the middle, at the peak. Being in the “top 65%” means 35% of people have a lower score.
couldn’t be clearer.
on the bright side, even if this were a really good test, 94 is probably within margin of error from true average.
Lol, I’m in the top 99% and I rarely brag about it 😌
Except for right now, apparently
Did you not get the joke?
Is this a humiliation kink thing? I can get how you’d mistake “top 65%” as a good thing and send it to your friends (not because it’s confusing, but because you’re in the top 65%). But then you post your low IQ to multiple communities while making it clear you didn’t understand the results page.
I’d be embarrassed just admitting I took an online IQ test.
I think I’ve seen people take the “Mensa Norway” IQ test: https://test.mensa.no/ That has an advantage over most other websites in that it provides a result that seems quite specific, and it doesn’t require payment in order to see that result.
Afaik mensa is as bullshitty as IQ itself.
Well admittance to Mensa is based on IQ tests, so it kind of follows.
But as far as IQ tests do go, Mensa will probably offer a better one than some random ass website that milks its victims for money.
I don’t think the curve actualy looks like that. There’s a shit ton of stupid people. I think it’s more like a line starting high on the left with low IQ and trending downward to the right and higher IQ.
the curve is ordinal, meaning that most people (68% of people) will score 85-115, give or take 15 - meaning if you take the test 3 times and get 100, 93.and 107… you can consider them all roughly the same score.
That’s because most people wouldn’t struggle with:
[xooo] [oxoo] [ooxo] what comes next?
[oxox] [xoxo] [ooox] [xxxo]
It seems that IQ tests are always used with a normal distribution.
I don’t know whether IQ/intelligence is actually normally distributed, but it seems that IQ test results are.
To find a graph that better matches what you described, you might be interested in https://en.wikipedia.org/wiki/Cumulative_distribution_function and/or https://en.wikipedia.org/wiki/Skewness


